Keywords: Coastal Monitoring, Earth Observation, Machine Learning, Shoreline Change
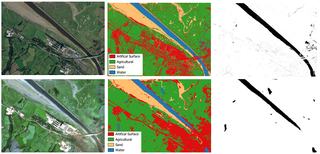
Figure 1: Comparison of satellite imagery and classification results at Connah's Quay. (a) Pléiades Neo true-colour image ANN-classified landcover map and binary image. (b) Sentinel-2 true-colour image, classified landcover map and binary image. These images illustrate differences in spatial detail and classification precision between medium-resolution (10 m) and very high-resolution (30 cm) data.
Coastal shorelines are dynamic environments shaped by erosion, sediment transport, and sea-level changes. Traditional shoreline mapping relies on manual surveys, which can be time consuming and limited in coverage. This case study explores how machine learning and Earth Observation (EO) data can automate shoreline extraction, offering a scalable approach for efficient coastal monitoring.
The study focuses on Connah’s Quay, aiming to evaluate how satellite data resolution affects shoreline delineation and classification accuracy. Connah’s Quay is prone to flooding and dynamic shoreline changes, making it an ideal site to test automated extraction methods and assess their ability to capture fine-scale land–water boundaries. By comparing medium- and very high-resolution imagery, the potential for automated approaches to detect fine-scale land-water boundaries was assessed.
For this study, two near-coincident satellite datasets were used to compare how resolution affects shoreline detection:
Sentinel-2: 10 Oct 2024 | 10 m resolution | Open (ESA)
Pléiades Neo: 12 Oct 2024 | 0.3 m resolution | Commercial (Airbus)
These dates allowed comparison under similar environmental conditions, minimising the effects of tides or weather on shoreline position.
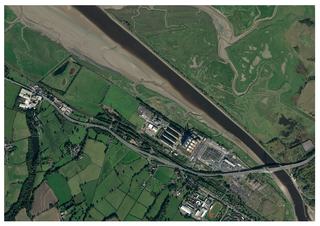
Figure 2: Pléiades Neo acquisition of Connah's Quay, Wales © Airbus DS (2024)
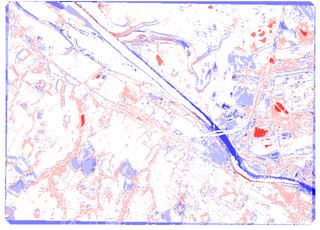
Figure 3: Difference map between Pléiades Neo and Sentinel-2 classified outputs. Blue areas indicate where Sentinel-2 underestimates the land-water class relative to PNEO, red areas indicate overestimation, and white indicates agreement. This map highlights the spatial discrepancies introduced by varying satellite resolutions.
Processing and analysis were conducted in Python, using a combination of geospatial and machine learning libraries. The workflow used the cloud-based infrastructure of the Earth Observation Data Hub, allowing multi-source data integration and efficient computational scaling.
Key tools and platforms included:
By integrating data access, preprocessing, and machine learning within the EODH, the workflow allowed a seamless transition from raw imagery to classification results.
To enable automated shoreline extraction and comparison across datasets, a multi-step workflow was developed:
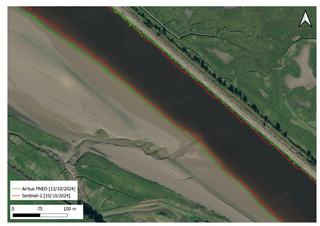
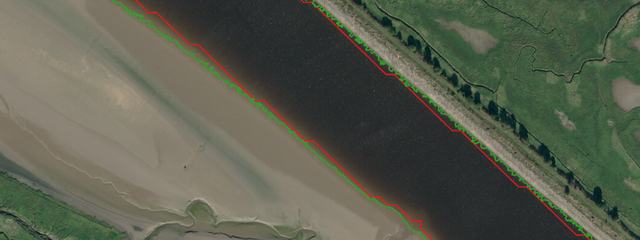
Figure 4: Shorelines extracted from ANN-classified imagery overlaid on the Pléiades Neo image. Green lines represent shorelines derived from Pléiades Neo classification, while red lines represent shorelines from Sentinel-2 classification. The visualization demonstrates how higher-resolution imagery allows for more detailed and precise shoreline delineation.
☑️ Immediate access to EO data. Sentinel-2 imagery available instantly without the need for download
☑️ Cloud-based processing. No reliance on local computing power
☑️ Integrated workspace. Scripts, data, and outputs stored in one organised environment
☑️ Single point of access. Centralised platform for discovering and working with EO datasets
By combining AI-driven classification with the EODH platform, this workflow provides a scalable, repeatable approach for coastal monitoring. Key benefits include:
Accurate detection of land-water boundaries at multiple spatial scales
Reduced reliance on field surveys and manual digitisation
Support for long-term environmental monitoring and coastal management decisions
Framework for multi-site and multi-temporal analysis, enabling consistent assessments of shoreline change over time
This case study demonstrates the potential of automated shoreline extraction using cloud-hosted EO data. The workflow can be applied to additional imagery, allowing shoreline features to be captured across multiple sites over longer temporal scales. By integrating both high-resolution and open-access datasets, it can support ongoing monitoring of shoreline change over time.